Supply Chain Market Research - SCMR LLC
  • Blog
  • Home
  • About us
  • Contact

LCD Large Panel Shipments – July Final

8/23/2021

0 Comments


LCD Large Panel Shipments – July Final
​

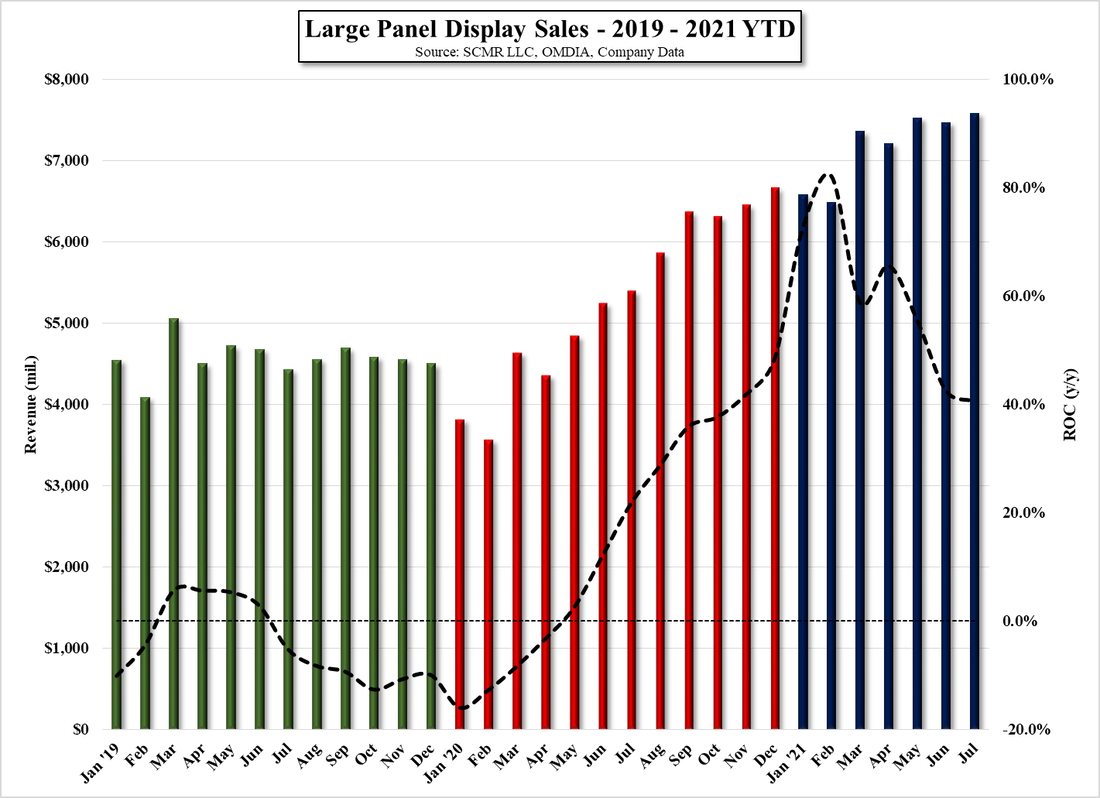
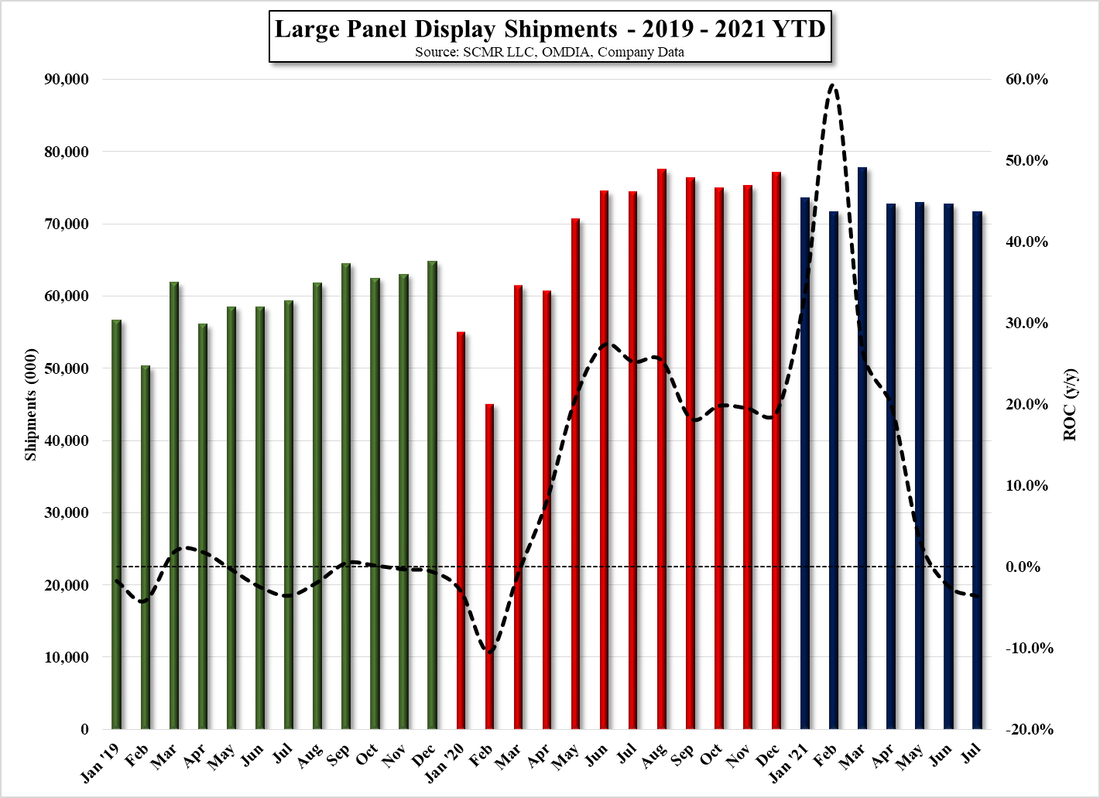
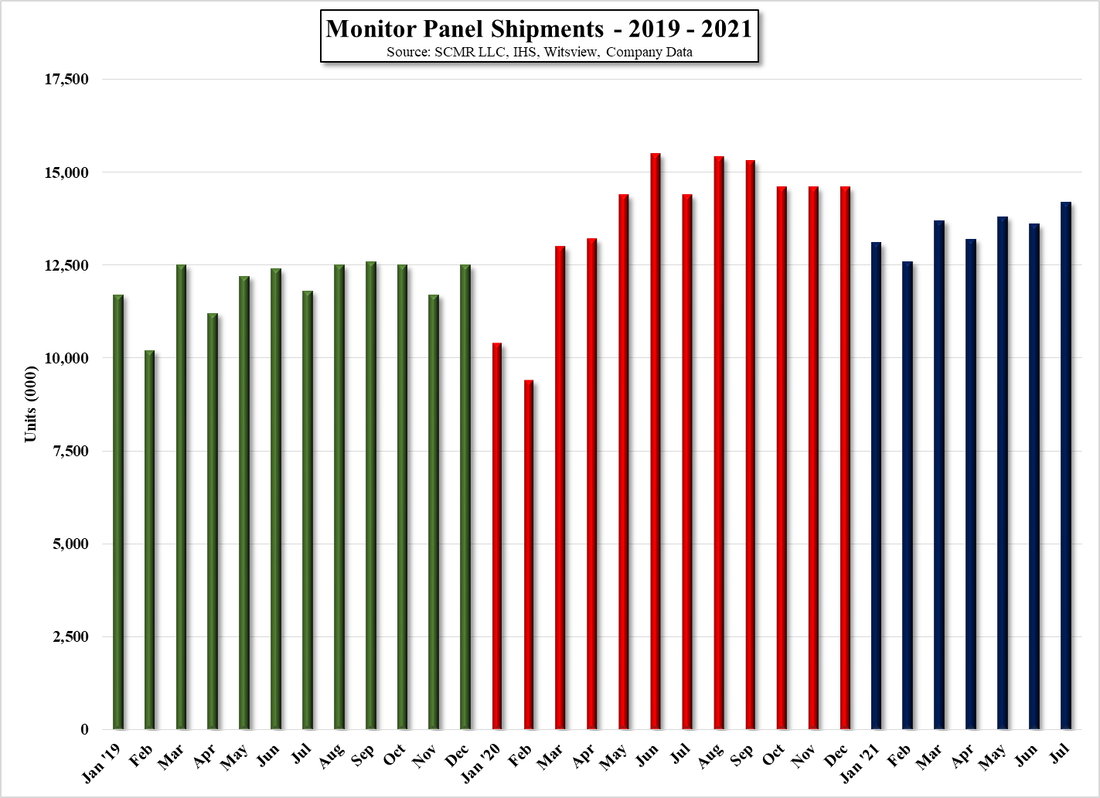
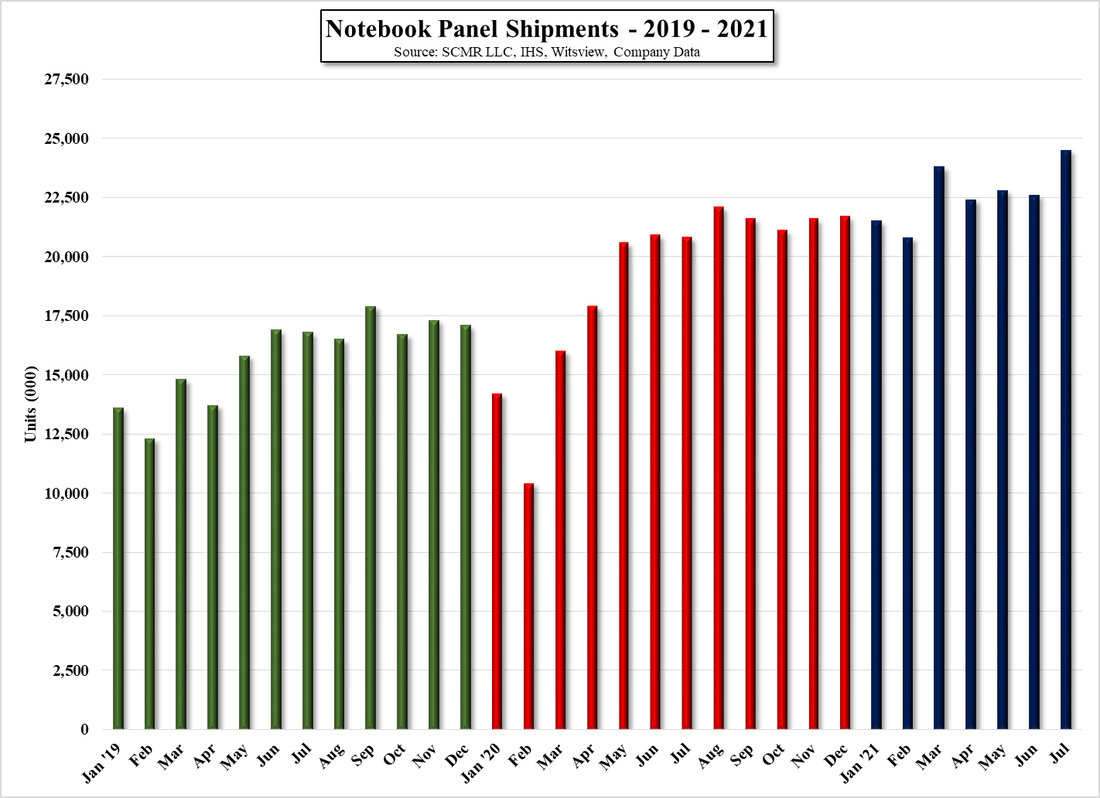
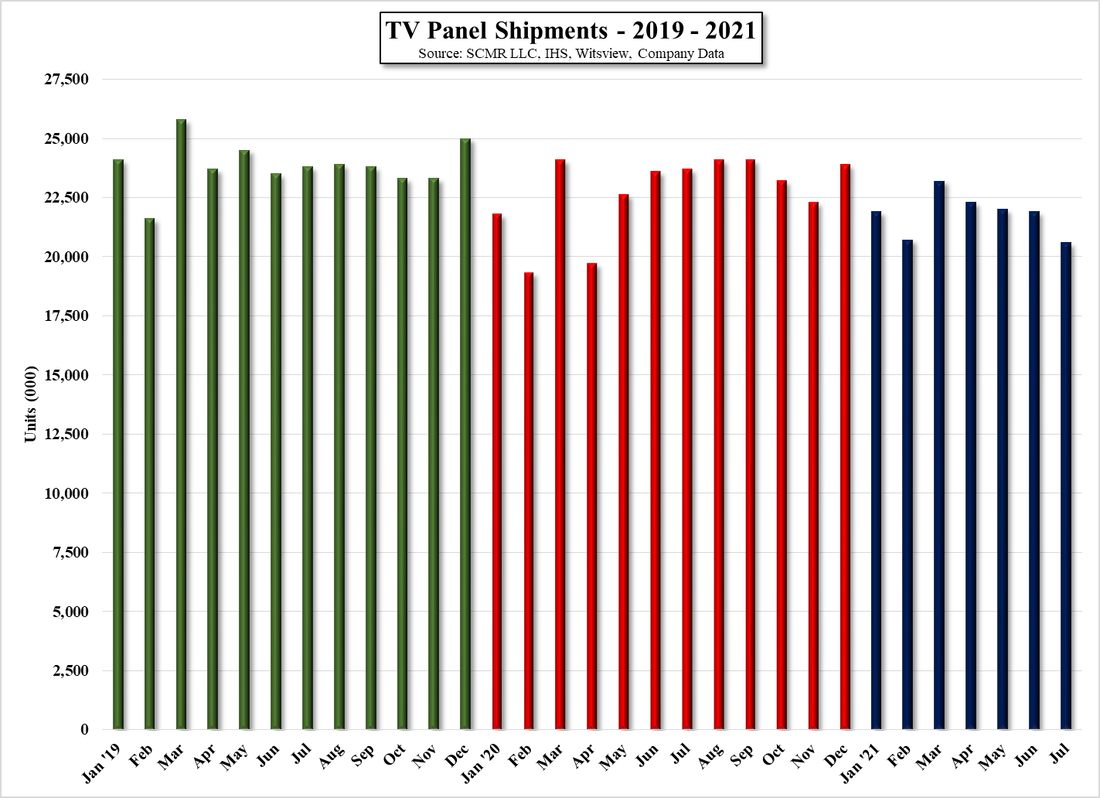
After seeing August results for panel prices above, the fact that large panel sales increased in July by 1.5% seems a bit unspectacular.  While we would expect the impact of the August drop in large panel prices to be felt the greatest in China, as it has been averaging 48.7% of industry large panel sales, both Taiwan (26.5% avg.) and South Korea (19.7%) will also feel some of the effects, and any slowdown in shipments of panel prices for monitors and notebooks will exacerbate the impact.  July saw overall large panel shipments down 1.4% m/m but was offset by a 2.9% increase in ASP (m/m) which is a bit off from typical July shipments, which average (5 year) +1.0%.  August is typically a stronger month, averaging +4.8% in m/m shipments and a 5.6% increase in large panel sales, but the impact of the TV panel price drop will impact overall industry sales, regardless of shipments, unless there is some anomaly that pushes shipments out of normal range for August.  As July is a ‘rear-view mirror’ month, given what we know about August, the charts below will tell the story.
Picture
Large Panel Display Sales - 2019 - 2021 YTYD - Source: SCMR LLC, OMDIA, Company Data
Picture
Large Panel Display Shipments - 2019 - 2021 YTD - Source: SCMR LLC, OMDIA, Company Data
Picture
Monitor Panel Shipments - 2019 - 2021 YTD - Source: SCMR LLC, IHS, Witsview, Company Data
Picture
Notebook Panel Shipments - 2019 - 2021 YTD - Source: SCMR LLC, IHS, Witsview, Company Data
Picture
TV Panel Shipments - 2019 - 2021 YTD - Source: SCMR LLC, IHS, Witsview, Company Data
0 Comments

Panel Prices – “Elevator Out of Service”

8/23/2021

0 Comments


Panel Prices – “Elevator Out of Service”
​

LCD panel prices, particularly TV panel prices, have been on the rise since last May.  During June and July there were rumblings that demand was slowing a bit and perhaps 3Q would not see the rapid price increases that had been seen in previous months.  Some of this ‘cautionary talk’ cited component shortages, double ordering, and COVID-19 outbreaks as the root cause, but as we said in our 08/06/21 note, the rest of the industry nodded quietly during such discussions but indicates that those factors have not affected their business and expectations remain unchanged. 
Our expectations for August were for relatively modest increases in IT product panel prices (Monitors & Notebooks), while TV panel prices were a bit more bifurcated, with the most price pressure on smaller TV panels, while demand for larger TV panels was a bit better and could see some increases, although the aggregate was down.  We did note that panel producers have been shifting capacity away from TV panel production toward IT products, the leverage toward production of those panels has certainly been favorable for LCD panel producers, but at some point that leverage will work against panel producers should demand slow in that segment, more a matter of ‘when’ than ‘if’.
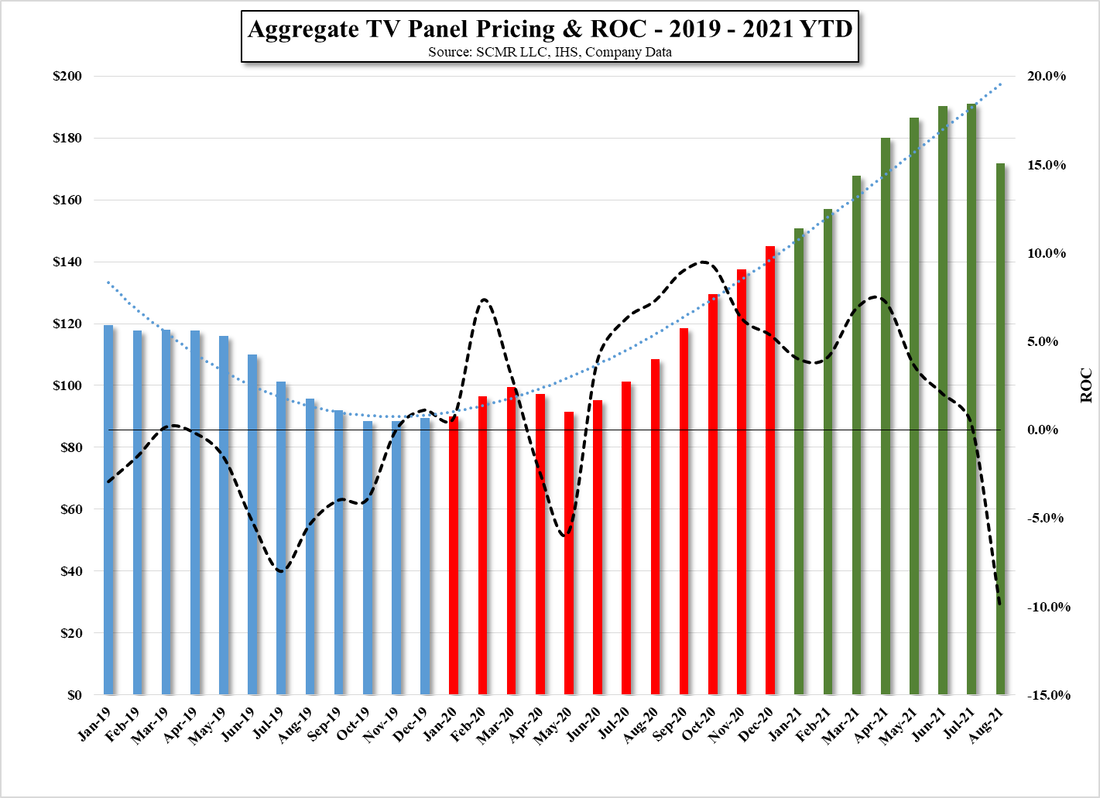
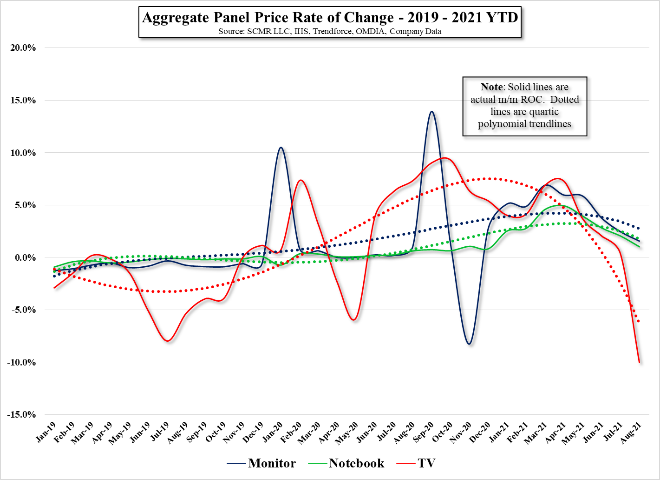
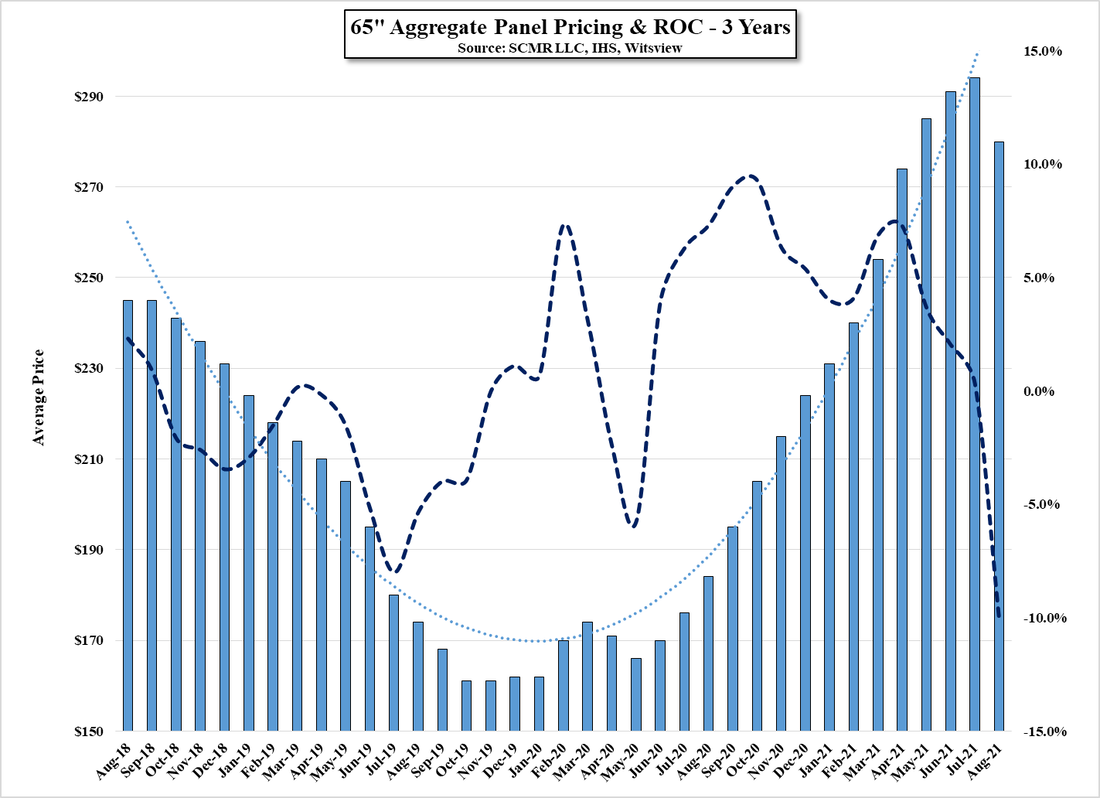
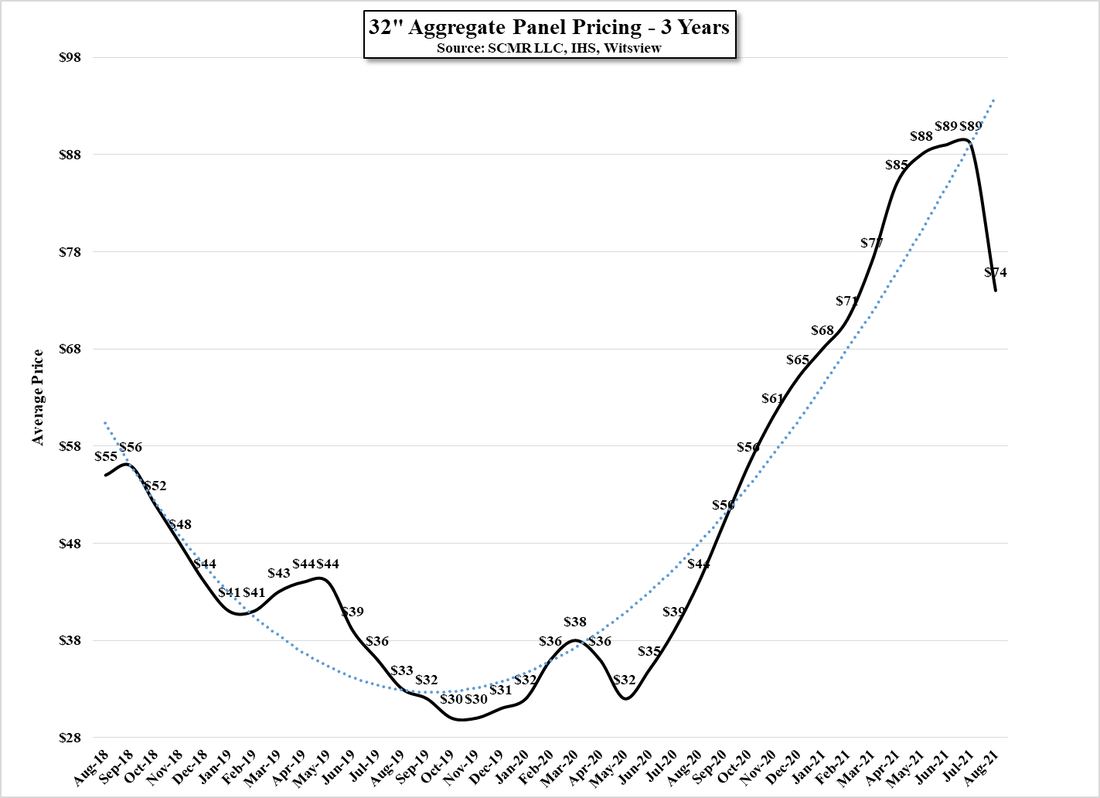
That was not the case in August for IT products, panel prices rose again, but it was the case for TV panels who saw the first aggregate TV panel price drop since May 2020, with prices down 10.1%.  It is difficult to pinpoint which of the potential factors caused the greatest impact to TV panel prices, but we expect all of the contributing factors that we have mentioned in the past, including component shortages, higher logistics costs, and the realization that higher overall TV set prices would stifle consumer demand, finally became reality for TV set producers and their expectations for 3Q and the holiday season began to wither on the vine.  In the case of TV panel prices, the withering was not just for smaller TV panel sizes but across the board and far greater than even our modestly pessimistic view had expected.
Picture
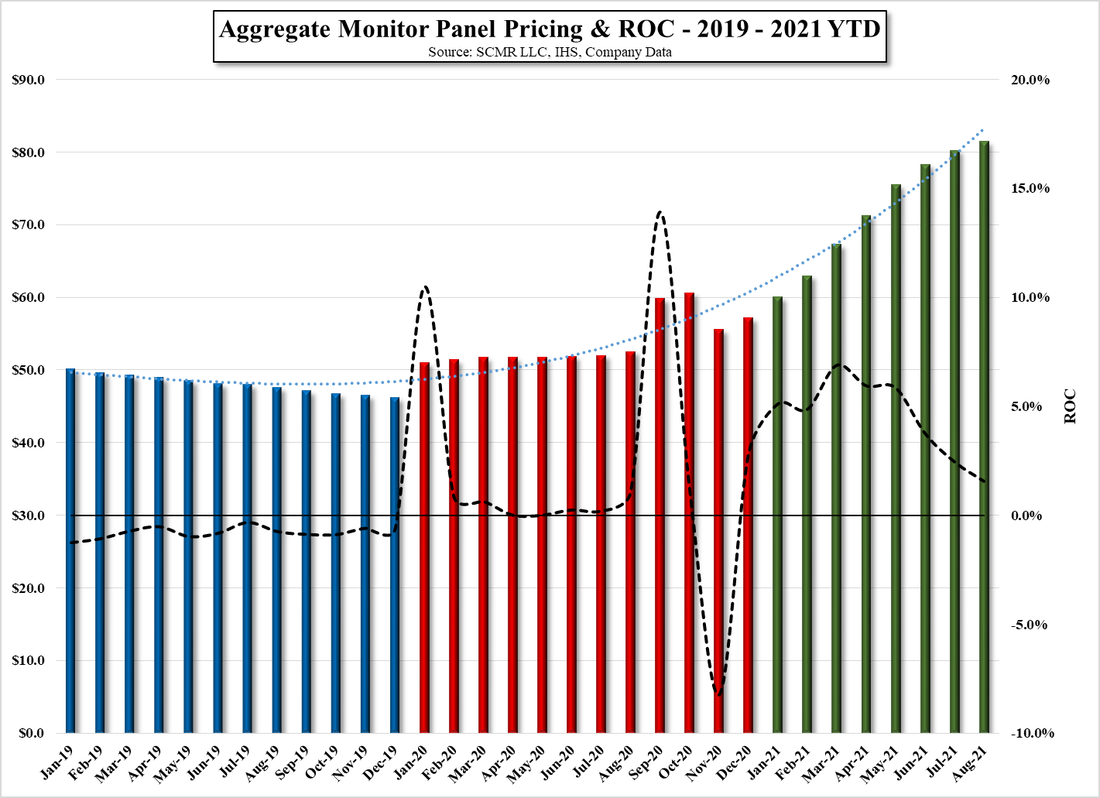
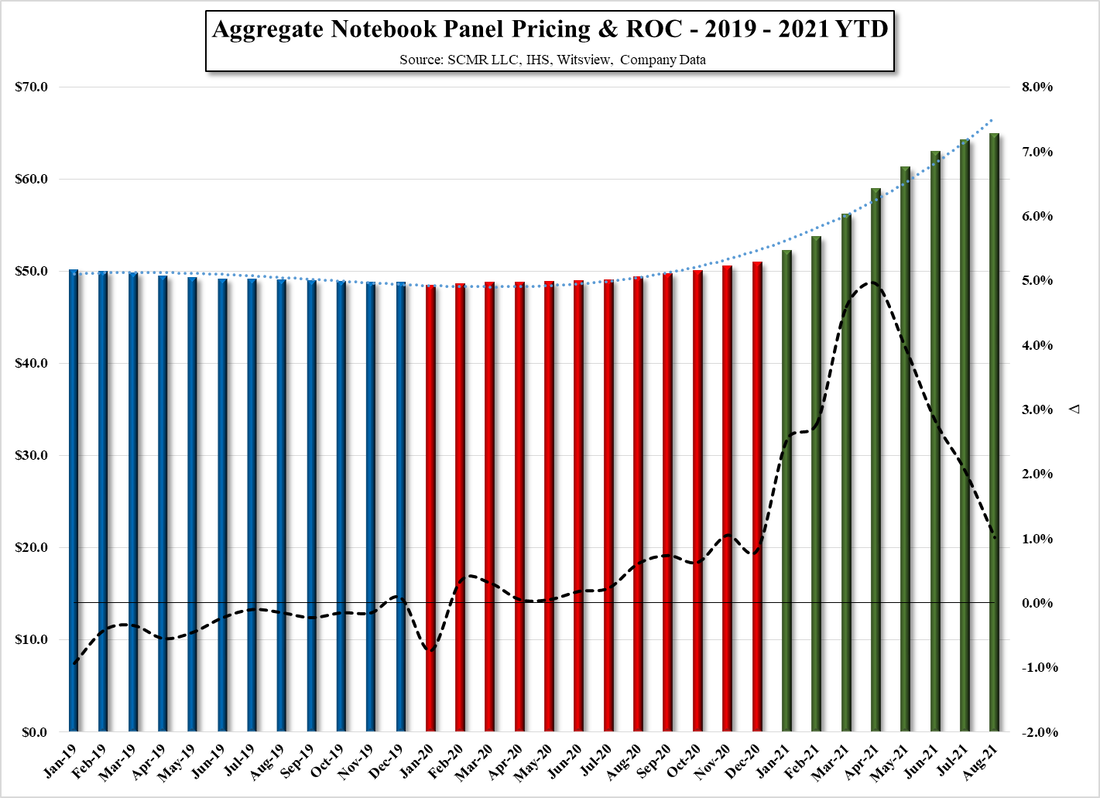
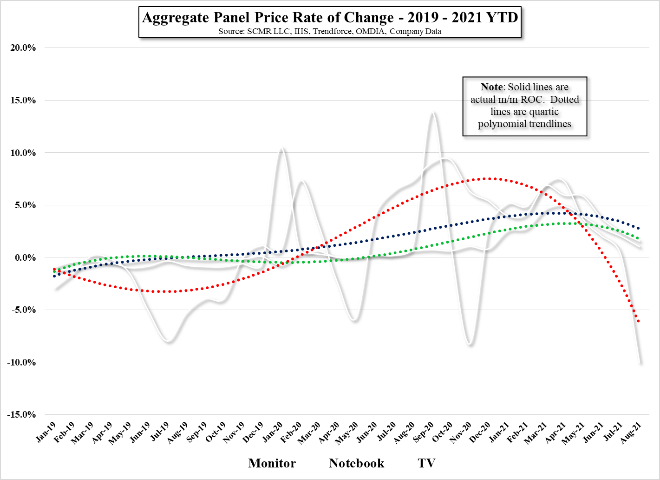
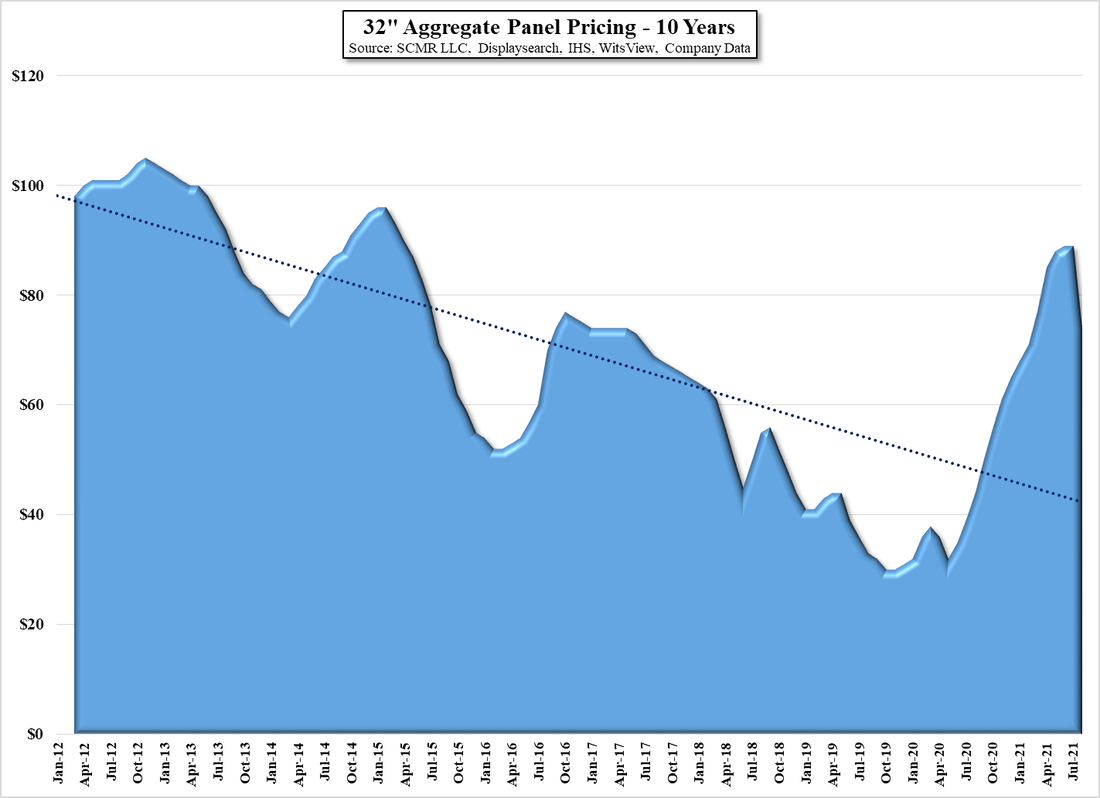
Figs. 1 – 3 show aggregate panel prices for the three major categories, while we show the ROC for those categories in Fig. 4 & 5, with the actual prices removed in Fig. 5, leaving only the trend lines.  To better show how severe the price drop was for TV panels, we have included both Fig. 6 & Fig. 7, which show 65” (large) and 32” (small) TV panel pricing for additional clarity, but we also point out that even after the -10.1% drop in aggregate TV panel prices, they are still up 86.96% over the aggregate price in May 2020, the last month where TV panel prices saw declines, so while the drop in August was significant, Fig. 8 shows that over the long-term 32” (and most other) panel prices have been declining, which leaves a big opening as to where TV panel prices will bottom out and more importantly, the effect falling TV panel prices will have on panel producer profitability going forward.  It’s a bit early to forecast September panel pricing, but we are keeping our expectations low for all categories and see little reason for anything more than a situation similar to August thus far.
Picture
Aggregate Monitor Panel Pricing & ROC - 2019 - 2021 YTD - Source: SCMR LLC, IHS, Company Data
Picture
Aggregate Notebook Panel Pricing & ROC - 2019 - 2021 YTD - Source: SCMR LLC, IHS, Witsview, Company Data
Picture
Aggregate TV Panel Pricing & ROC - 2019 - 2021 YTD - Source: SCMR LLC, IHS, Witsview, Company Data
​Figure 4 & 5 - Aggregate Panel Price ROC - 2019 - 2021 YTD - Source: SCMR LLC, IHS, Trendforce, OMDIA, Company Data
Picture
65" Aggregate Panel Prices & ROC - 3 Years - Source: SCMR LLC, IHS, Witsview, Company Data
Picture
32" Aggregate Panel Pricing - 3 Years - Source: SCMR LLC, IHS, Witsview, Company Data
Picture
32" Aggregate Panel Pricing - 10 Years - Source: SCMR LLC, Displaysearch, IHS, Witsview, Company Data
0 Comments

Capacity vs Utilization – What’s in a Name?

8/20/2021

0 Comments


Capacity vs Utilization – What’s in a Name?
​

​When looking at large scale manufacturing and panel producers in particular, it becomes apparent that semantics can make a big difference in understanding production capacity.  Panel producers have many names for production metrics and use them selectively, usually to make a positive point, but when it comes down to a realistic view of display production, the words do make a difference.  There is ‘stated capacity’, which is the capacity that was considered when designing the fab, say 90,000 sheets/month at Gen 8.5.  Most would assume that when that term is used one can assume that the fab is fully built out, which is certainly not the case in most instances. 
Display production lines are usually installed in ‘phases’, with the building shell, power, and water feeds installed up front, but the production lines themselves built out in a staggered fashion, say in this case as three 30,000 sheet/month lines.  Once the initial line, which in this case would typically consist of two 15,000 sheet/month sub-lines and a similar set of lines for TFT (Thin-film transistor), is completed, the line goes into test mode, where substrates are run through the line and both optical and electrical inspection tools trace problems on the line.  As the equipment is ‘tuned’ during the test process only a small number of substrate panels are run through the line given that equipment is still being optimized,  and while no client oriented production is being done, many panel producers call the fab ‘open’ when a substrate is able to run from one end of the line to the other. 
The ‘open’ moniker can also be applied even if only a subset of the phase one production lines are running, say one 15,000 sheet/month line, and while there might be equipment set up for the next 15,000 sheet/month increment, it has not yet entered the test mode.  Once all of the phase one line’s equipment is being utilized, even though the fab is only producing small numbers of completed panels, the fab is usually said to be in ‘mass production’. 
This is a key point for panel producers as once a fab enters mass production depreciation begins and both line utilization and yield become the driver for fab profitability.  When fabs begin mass production producers must balance low product yields against fab utilization rates, essentially wanting the fab to be fully utilized to maximize margin, but not wanting to produce high volumes of panels with low yields that generate losses.  Ideally producers want high utilization, meaning the fab in producing at or near its stated capacity, but if product yields are low, meaning many finished panels have to be scrapped, running the fab at full utilization can be quite costly, so low product yield tends to also imply low fab utilization rates. 
Ideally, the production in a fab’s early stage is driven by customer orders, but more realistically much of the early production is for evaluation samples that need to be qualified by customers, regardless of whether they have been supplied by the producers other fabs.  During the qualification process, which can entail modifications to product and/or production processes and a number of iterations for sample panels, most producers will consider the fab ‘ramping’, which implies ‘not at full capacity’ or ‘not at full utilization’ but also with the implication that yields and utilization rates are improving. 
This is where things get quite difficult to decipher, both from the standpoint of gauging actual production (units and value) and profitability, as ‘ramping’ has no modifier.  We have seen fabs ‘ramp’ for a few months and others ramp for years, so utilization then becomes the only way to understand how much a fab is actually producing and that data tends to be released or leaked only when it serves to put the producer in a positive light.  Utilization rates can be calculated if area production is known however many panel producers only give production area metrics based on ‘available capacity’, which means the fabs’ capacity during the period (inclusive of maintenance, downtime, etc.) which is not its ‘stated’ capacity but some subset or superset of that figure.
The implications of true utilization metrics are quite significant and can be very different depending on the display technology and the complexity of the process.  LCD display production, given its ubiquity and maturity as a display modality, typically has a higher utilization rate than OLED production, which has some production peculiarities and potential variations that make its production a bit more difficult and less mature, but the true driver for utilization is the ability of the producer to time new capacity to the market and develop new display products that stimulate customer demand, along with more general global economics and pricing characteristics.
Currently, given the demand cycle created by the COVID-19 pandemic, LCD utilization rates are high for both large and small panel producers, in the low 90% range for small panel producers and in the mid 90% range for large panel producers, while utilization rates for OLED producers are considerably lower, although that varies considerably between producers.  Looking at just Chinese LCD producers and applying a blended LCD utilization rate of 94.2%, that segment of the industry could produce 18.36m 32” panel equivalents in June, vs. just a bit over 20m 32” equivalents for stated capacity, but when it comes to OLED the difference between the number of units actually produced and stated capacity is far more obvious. 
At June OLED utilization rates Chinese OLED producers were able to produce 30.89m 6.5” displays against a stated capacity of what would be 70.37m 6.5” OLED display equivalents, but in July, as OLED capacity at the country’s largest producer BOE (200725.CH) ‘ramped’ at two of its fabs increasing stated capacity by 12.3%, the unit volume improved by 26.3% to 39.02m 6.5” equivalents as overall OLED utilization at Chinese OLED fabs in aggregate increased by 5.5%, showing the production leverage even relatively small improvements in fab utilization can garner.  When coupled with yield improvements that leverage is further magnified.
That said, utilization data is hard to come by and panel producers, particularly those in China are want to be as vague as possible, particularly toward OLED utilization rates, but it is essential for investors to understand the difference between stated capacity and real production, and to understand that terms like ‘improving’ and ‘ramping’ have little meaning unless they are either accompanied by metrics or detailed qualifiers..  Many Chinese panel producers state display project goals, especially when raising project capital, based on what sales the fab would generate when fully built out and running at stated capacity.  As ‘ramping’ toward the goal of full utilization could take a few quarters or many years, a bit these are essentially pie-in-the-sky numbers and should never be confused with realistic production goals based on panel producer experience, the balance between supply and demand, and the maturity of the technology.
0 Comments

TV Panel Demand – Hard Reality

8/18/2021

0 Comments


TV Panel Demand – Hard Reality
​

TV set demand has been a disappointing this year, as China TV demand has been weak for some time and the North American market, which had been the strongest region last year and early this year, has also been slowing.  TV set producers have been facing a number of problems, particularly the rapid rise of LCD panel prices, which are the most costly single component of most sets, and overall higher component prices, which have forced set brands to raise prices an offer fewer discounts to attract customers.  That said, the 2nd half is typically the stronger as brands build inventory for the holiday season, and while demand might be weaker than brand targets might have predicted late last year, they typically buy more large LCD panels in 3Q and 4Q than in the first two quarters.
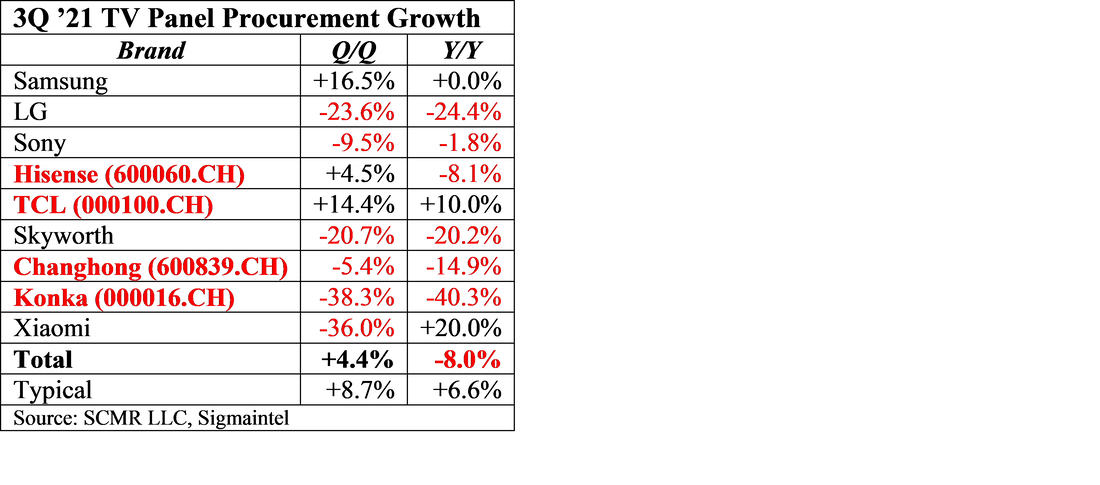
Typical large panel shipment growth has been 13% (5 year average) on a half/half basis and typical (5 year average) growth in large panel shipments in 3Q (q/q) has been 8.7%.  While headlines might read that TV vendors are increasing panel procurement in 3Q, the numbers tell a bit of a different story.  Large panel procurement is expected to be up 4.4% in 3Q, just below half of the 5 year average and will be down 8.0% on a y/y basis, with only three of the top TV brands seeing a q/q increase and only two seeing y/y increases.  Samsung Electronics, one of the three increasing panel purchases over 2Q levels, has been unable to meet its panel requirements due to component shortages, while Xiaomi (1810.HK), who has been growing its TV business despite the slowdown, seems to have over anticipated that growth last quarter and will see a decline in large panel purchases of 36% q/q, despite still being up 20% y/y.
While many LCD panel producers have reduced their exposure to the TV panel market, it is still a significant revenue generator for producers and is an even more important part of capacity utilization given the size of TV panels, so the impact of relatively weak TV panel sales is considerable.  More importantly it gives some indication as to which brands have built set inventory that now might be a bit ahead of realistic sales expectations or that their earlier set targets were too high.  Here’s how the data looks for 3Q panel procurement:
Picture
0 Comments

Gen 8 RGB OLED Expands

8/16/2021

0 Comments


Gen 8 RGB OLED Expands
​

​We have noted (08/02/21, 08/10/21) that Samsung Display (pvt) has been developing an alternative method for OLED material deposition that would allow the production of RGB OLED displays on Gen 8 production lines.  The Samsung project has been in partnership with Ulvac (6728.JP) in terms of the deposition tool itself, essentially the heart of the process, but other tool vendors have also been developing equipment that would become part of the Gen 8 RGB OLED process and Samsung Display is not alone in trying to develop a Gen 8 RGB process deposition tool.  LG Display (LPL) has also been working toward the same goal, working with Sunic Systems (171090.KS) to adapt the process to the larger substrate format, and Dai Nippon Printing (7912.JP), the largest supplier of the FMM (Fine Metal Masks) that are what patterns the OLED material, has been developing larger masks that can be used in the new process.
Typically FMMs are limited to Gen 6 fabs or smaller as the masks begin to sag when they are larger than Gen 6.  This makes it impossible to produce patterned RGB OLED display on fabs above Gen 6, which limits the efficiency of the process.  By changing the orientation of the deposition tool from horizontal, where gravity works against the FMM to vertical, the mask size can be increased without losing the precise material alignment that the masks provide.  Since using FMMs has been the basis for the RGB OLED process, this would allow the industry to become more cost efficient without relying on new processes such as ink-jet printing and would give Samsung Display a way to directly compete with LG Display in the OLED TV space, without the compromise of using OLED materials and a color filter, which reduces brightness.
We have seen a number of other ‘vertical’ OLED process equipment but the most developed seems to be from OLEDON (pvt), a South Korean company that has been developing the technology along with a process that transfers the materials from a donor film that is pulled into the chamber via a belt.  However that process, while it allows for large substrates, is applicable to ‘open mask’ displays, such as LG Display’s OLED TVs and does not ‘pattern’ the material, which is SDC’s objective.
While we expect none of the OLED panel producers that are developing such process technology have fully committed to same, those decisions will likely be made after pilot lines are put into operation, likely next year.  If successful, product from the technology would likely become available 12 to 16 months later as production space is converted from existing or idle Gen 8 LCD production to V-OLED (Vertical OLED).  Again, if successful, this would have a significant impact on the large panel OLED space and would be a boon to the OLED industry as a whole, expanding large panel OLED production and making large panel OLED more price competitive against other existing or potential display technologies.
0 Comments

Fox in the Henhouse

8/12/2021

0 Comments


Fox in the Henhouse

​The display glass business is an unusual one, with a small number of suppliers providing the bulk of the substrate material for major panel producers.  Corning (GLW) is the leading supplier, competing with Asahi (5201.JP) and NEG (5214.JP), while a number of smaller suppliers such as Schott (pvt), IRICO (600707.CH), Avanstrate (pvt), and Dongxu (000413.CH), fill in more specialized products.  Panel suppliers have established long=term relationships with primary display glass providers, with a number of glass production sites co-located with display panel fabs.  Corning has well-known relationships with Samsung Display, BOE (200725.CH) and a number of other producers, but the primary display glass supplier to LG Display (LPL), has been Paju Electric Glass (pvt), a joint venture between LG Display and NEG.
While we expect Corning has always supplied some glass product to LG Display, the NEG relationship has been a long one and gives LG Display a mechanism for matching new product production timelines to glass substrate production.  But as the display industry becomes more segmented and specialized, alternative suppliers have a chance at entering the display supply chain for major producers, and while they rarely are able to meet the volumes that top panel producers need for more generic products, they are certainly able to provide product for those more specialized display products. 
In LG Display’s case, they have been using two smaller display glass suppliers for their automotive displays, China’s Tunghsu Optoelectronics aka DongXu, and local firm, Tovis (051360.KS) and while we expect the automotive display business is a relatively small one compared to the TV, IT, and mobile display businesses, it carries high margins and is therefore a focus for panel producers who are always working against declining panel prices and tight margins.   According to Korean press, it seems that Corning has been able to insert itself into the LG Display automotive display supply chain and capture ~10% of the automotive display substrate business from the existing suppliers by offering pricing below that of the two smaller competitors.
This is significant in that it gives Corning another possible entry point toward establishing a larger relationship with LG Display, and while it is a small step, if LG Display grows its automotive display business, Corning has a backdoor to gaining some ground at LGD.  We don’t think this ‘incursion’ will lead to a change in LGD’s primary relationship with NEG, but it seems that Corning’s impact is being felt by Dongxu and Tovis, with the later already seeing a drop in sales to LGD’s parent LG Electronics (066570.KS) as they have recently shuttered their mobile phone division.  With Corning’s array of glass products it is hard to imagine that once the door is opened, they won’t push further in.
0 Comments

But…

8/12/2021

0 Comments


But…
​

​While Corning is making some headway at LG Display, the battle between Corning and Schott for Samsung Display’s new foldables seems to be going Schott’s way.  Schott has been the incumbent in Samsung’s previous foldables but was facing significant competition in the UTG (ultra-thin glass) space from Corning, along-time supplier to SDC.  The new version of Samsung’s Galaxy Fold series (see above) has been developed to use the S-pen writing stylus, formerly used on Samsung’s Galaxy Note line.  As the stylus touch system adds a bit of thickness to the device, it seems that SDC has chosen Schott’s 30um UTG over Samsung’s 50um UTG for the new devices to compensate for the added thickness.  Corning’s UTG would have had to be thinned, post production, to bring it to the same size.
While this means that Schott will supply the majority of the glass for these two new devices, there is still the question of cover glass, which in the case of the Fold 3, must also be able to protect the display from stylus pressure.  While we do not know yet know who the folded cover glass provider is or whether a plastic cover has been used, we know that Corning’s Victus (Gorilla Glass) is being used for the back of the Fold 3 and the Flip 3.  More to come.
0 Comments

Glass Half Full?

8/9/2021

0 Comments


Glass Half Full?
​

​Taiwan based LCD panel producer Innolux (3481.TT) indicated that while the ongoing chip shortage and a tightening of substrate glass supply would cause the industry to see reduced panel production, they remain cautiously optimistic about the 2nd half.  Innolux management indicated that a glass substrate supplier would be cutting its utilization by 15% to 20% in order to do annual maintenance, tightening what has already been a tight glass market, and would lead to the reduction in panels being produced during the 3rd quarter.  Their take on the 3Q panel squeeze was that the reduction in panel production would reduce supply and avoid a glut, although the company had not mentioned that an oversupply situation was a possibility in the past.  Singling out IT products as the area where there was an imbalance between supply and demand, they indicated that the reduction should ease those concerns.
As we have noted a number of times in the past, LCD panel producers have been shifting production away from large panels (TV), where demand has weakened, and moved to IT products, meaning monitors, notebooks, and tablets.  While logic holds that panel producers would follow those areas with the highest profit potential, capacity has increased relatively quickly while demand has stayed relatively flat, especially if one accounts for the potential component shortages that have limited deliveries or pushed out dates.  This has caused buyers to ‘enhance’ ordering a bit by increasing numbers to encourage allocations and meet quotas despite possible shortages.  As brand inventories get closer to real quotas, those orders become more realistic and panel producers are left with excess capacity, a situation they have not faced in over a year. 
The TV panel space is already seeing some panel price weakness, however the IT space, where the capacity shift has been the greatest, has seen only less aggressive panel price increases and has yet to see real panel price declines.  While the annual maintenance period during August is not unusual for glass producers, given the tight market and the high level of production at all of the glass producers that maintenance cannot be avoided and some shortages above the recent norm might be seen, but we have a hard time seeing this scenario as a glass half full one, rather than one indicating the potential for change., But then we are not sitting on billions of dollars’ worth of capital equipment that needs to be running at or near full capacity to produce profits.  Just a difference in perspective.
0 Comments

Early August Panel Prices

8/6/2021

0 Comments


Early August Panel Prices
​

There has been some cautionary talk among some in the display supply chain about the possibility that the rapid panel price increases seen over the last year might slow or even decline over the next few months.  Those in that camp cite component shortages, double ordering, and COVID-19 outbreaks as the root cause, while the rest of the industry nods quietly during such discussions but indicates that those factors have not affected their business and expectations remain unchanged.  While we do not expect the outlook for panel prices to fall off a cliff, we do expect less panel price increase momentum as we have stated previously.
Our expectations for August panel prices indicate that IT products, primarily notebooks and monitors, will continue to see upward panel price movement, but TV panel prices, depending on size, will see some price declines.  Since we aggregate panel prices, both from a number of sources and by size, the overall panel price movement can belie the fact that some panel sizes can see price increase while the aggregate price is negative.  This is a normal occurrence in many panel categories, however it become consequential when there is a change in momentum, as we believe is currently afoot.   In the TV space, smaller TV panel (32” to 55”) prices are expected to decline, while larger (65” and above) are expected to rise, as the consumer’s quest for larger TVs continues, while smaller TVs, more common in developing markets, are more easily produced and are offered by a large number of panel producers.
As to the real reasoning behind this change in panel pricing perspective, while component shortages can limit panel output, the underlying demand is the true driver for panel pricing, and while demand for IT products remains relatively strong currently, TV demand has been weakening as the COVID-19 vaccines have begun to ease concerns about venturing outside and away from a TV screen.  Right now this is an iffy proposition, as the ebb and flow of COVID-19 can push sentiment in one direction or another, but the general focus, at least in most developed countries is that life is, at the least, trying to return to normal, which helps to break the bonds of TV binging. 
Notebooks still have yet to see demand slow, although some of the county-wide educational programs that have created such demand are beginning to tail off as students begin to repopulate classrooms.  We expect this will be the last display category to tail off, as the results of bringing students back to classrooms won’t be known until September or October, but monitors, for which demand has also remained strong, would be the segment that we expect could see some weakness over the next few months, with returning office workers offsetting some of the weaker stay-at-home demand.
From the supply side, while we expect capacity utilization to remain relatively high as we enter the seasonal build period, we have seen a more enthusiastic view of capacity additions from a number of panel producers in recent months.  Whether this is a result of being profitable for the last few quarters or a continuing need to dominate a particular display category, we do not know, and most of the proposed capacity increases, at least in the LCD space, are relatively small, or have been underway for more than a year. 
That said, while the capacity issue is certainly one we watch closely, the fact that most large panel producers have been shifting capacity away from TV panel production and increasing their IT panel output.  This is a logical move as IT panel demand remains visible while TV demand is less so.  IT panel products also tend to be more profitable on a per m2 basis, and the model variety is greater than the TV space, leading to a bit less head-to-head price competition and more specialized feature selection which leads to higher prices, but the shift toward IT panel production also carries significant risk when IT panel prices begin to weaken and utilization rates begin to decline.  We expect that IT panel buyers, who have been on the wrong side of the bargaining table for a year, will push to regain their negotiating leverage and panel producers will respond by quickly lowering prices.
None of this will happen in an instant, especially as we are entering the seasonal build period when panel demand is typically highest, but both panel and component price increases that have become almost normal across the CE space also add to that risk as consumers are less in need of immediate gratification and more willing to wait for more reasonable device prices.  Panel producers will not panic even when they see some order cancellations or cut backs, but when they are unable to fill that open capacity with new orders they will start making deals to keep fab utilization from falling.  They have yet to face that situation, but it is more of a ‘when’ than an ‘if’ situation in our view.
Picture
Picture
Aggregate Panel Price Rate of Change - 2019 - 2021 YTD - Source: SCMR LLC, IHS, Trendforce, OMDIA, Company Data
0 Comments

Innolux LT Deal for Large TV Panels

8/5/2021

0 Comments


Innolux LT Deal for Large TV Panels
​

Innolux (3481.TT) announced that it had signed a long-term supply deal with Sakai Display Products (pvt), the company that owns the formerly Sharp (6753.JP) Gen 10.5 LCD fab in Japan.  Innolux will pre-pay in installments, the $618m price of the 12 year deal through its subsidiary Foshan Optoelectronics (pvt).  Behind the concept of the deal is eliminating the cost of building a greenfield Gen 10.5 fab, which would likely cost between $1.9b and $3.3b for each 30,000 sheet/month line, of which there would likely be two.  Innolux currently runs one Gen 7.5 and two Gen 8 LCD fabs, with the Gen 7.5 fab most efficient at producing panels in the 42” to 46” range, and the Gen 8 fabs most efficient producing 55” panels, with TV panels representing 38% of Innolux’s 2Q sales.  However, as consumers look toward larger size TVs, the Innolux fabs become far less efficient at sizes of 65” and larger.  This has pushed Innolux to decide whether it would be more cost effective to build its own Gen 10.5 fab or sign a deal with Sakai Display, who runs a Gen 10.5 fab that has been in operation since 2009.
The decision is made a bit more obvious due to the fact that Sakai Display Products is owned by Terry Gou, the Chairman of Hon Hai (2317.TT aka Foxconn (2354.TT)), with the company owning a controlling stake in both Sharp and Innolux, so the deal is sort of an ‘all-in-the-family’ one that benefits all parties to some degree and Terry Gou in quite a few of them.  Sakai is expected to increase its capacity from 90,000 sheets/month to 120,000 and eventually to 150,000, but no timetable has been given and Foxconn has a long history of making promises and not fulfilling them, so we maintain our model at current capacity until we get confirmation that new lines have been added and are operating.  If such an expansion does become a reality will Mr. Gou provide the financing or will the capital be drawn from some other related entity?
Picture
Flags - Source: Bloomberg
0 Comments
<<Previous
Forward>>

    Author

    We publish daily notes to clients.  We archive selected notes here, please contact us at: ​[email protected] for detail or subscription information.

    Archives

    May 2025
    April 2025
    March 2025
    February 2025
    January 2025
    January 2024
    November 2023
    October 2023
    September 2023
    August 2023
    June 2023
    May 2023
    February 2023
    January 2023
    December 2022
    November 2022
    October 2022
    September 2022
    August 2022
    July 2022
    June 2022
    May 2022
    April 2022
    March 2022
    February 2022
    January 2022
    December 2021
    November 2021
    October 2021
    September 2021
    August 2021
    July 2021
    June 2021
    May 2021
    April 2021
    March 2021
    February 2021
    January 2021
    December 2020
    October 2020
    July 2020
    May 2020
    November 2019
    April 2019
    January 2019
    January 2018
    August 2017
    July 2017
    June 2017
    May 2017
    April 2017
    March 2017
    February 2017
    January 2017
    November 2016
    October 2016
    September 2016

    Categories

    All
    5G
    8K
    Aapl
    AI
    AMZN
    AR
    ASML
    Audio
    AUO
    Autonomous Engineering
    Bixby
    Boe
    China Consumer Electronics
    China - Consumer Electronics
    Chinastar
    Chromebooks
    Components
    Connected Home
    Consumer Electronics General
    Consumer Electronics - General
    Corning
    COVID
    Crypto
    Deepfake
    Deepseek
    Display Panels
    DLB
    E-Ink
    E Paper
    E-paper
    Facebook
    Facial Recognition
    Foldables
    Foxconn
    Free Space Optical Communication
    Global Foundries
    GOOG
    Hacking
    Hannstar
    Headphones
    Hisense
    HKC
    Huawei
    Idemitsu Kosan
    Igzo
    Ink Jet Printing
    Innolux
    Japan Display
    JOLED
    LEDs
    Lg Display
    Lg Electronics
    LG Innotek
    LIDAR
    Matter
    Mediatek
    Meta
    Metaverse
    Micro LED
    Micro-LED
    Micro-OLED
    Mini LED
    Misc.
    MmWave
    Monitors
    Nanosys
    NFT
    Notebooks
    Oled
    OpenAI
    QCOM
    QD/OLED
    Quantum Dots
    RFID
    Robotics
    Royole
    Samsung
    Samsung Display
    Samsung Electronics
    Sanan
    Semiconductors
    Sensors
    Sharp
    Shipping
    Smartphones
    Smart Stuff
    SNE
    Software
    Tariffs
    TCL
    Thaad
    Tianma
    TikTok
    TSM
    TV
    Universal Display
    Visionox
    VR
    Wearables
    Xiaomi

    RSS Feed

Site powered by Weebly. Managed by Bluehost